How to Know if Your Facebook Ads Are Working and Worth Running
Why Understanding Facebook Ad Performance Matters for Australian Businesses
If you own a business in Australia, you’ve likely considered using Facebook advertising (now part of Meta’s platform) to reach more potential customers and grow your brand. With over 16 million active Facebook users in Australia and countless digital advertising options, you need a clear way to decide whether Facebook ads are worth your investment.
One of Facebook’s biggest strengths is its sophisticated targeting. You can reach people based on:
- Demographics - age, gender, location, income, education, job title
- Interests - hobbies, pages they follow, content they engage with
- Behaviours - purchase history, device usage, travel patterns
This precision means you can show ads to people most likely to be interested in your products or services, dramatically improving your chances of generating qualified leads and sales.
But targeting alone doesn’t guarantee success. To know if your Facebook ads are actually working and delivering a return on investment, you must understand key performance metrics, optimisation strategies, and realistic benchmarks for your industry.
This guide walks you through how to evaluate Facebook ad performance and make data‑driven decisions about your ad spend.
TL;DR
- Use Facebook Ads Manager to track reach, impressions, clicks, conversions, and ROI.
- Core KPIs: CTR, CPC, conversion rate, ROAS, and CPL/CPA.
- Facebook CTR and conversion rates vary widely by industry and campaign objective, and published averages shift year to year. Benchmark against your own account history first.
- Strong results come from continuous testing, audience refinement, compelling creative, and optimised landing pages.
- Facebook Ads work best as part of a broader marketing strategy including SEO and email marketing.
Essential Facebook Ad Metrics to Track
Facebook Ads Manager shows dozens of metrics. Focus on these core ones to understand if your ads are truly working.
Reach and Impressions: Measuring Ad Visibility
- Reach = number of unique people who saw your ad at least once.
- Impressions = total number of times your ad was shown (including repeats).
- Frequency = impressions ÷ reach (average number of times each person saw your ad).
Watch frequency closely. When it climbs above 3-4, ad fatigue often sets in and performance drops. If frequency is rising while CTR falls, it’s time to:
- Refresh your creative (new images, videos, copy)
- Expand or adjust your audience
Click-Through Rate (CTR): Gauging Ad Relevance
CTR = (clicks ÷ impressions) × 100
According to WordStream’s Facebook benchmarks:
- Cross-industry averages move year to year, so check a current source rather than a fixed number
- Top-performing industries: 1.5-2.5%+
Targets:
- Cold audiences: aim for 1.5%+ CTR
- Retargeting: aim for 3%+ CTR
Higher CTR means your ad is more compelling and relevant. It also improves your competitiveness in Facebook’s auction, often lowering your costs.
To improve CTR, test:
- Different headlines
- Stronger hooks in the first 2-3 seconds of video
- New images or creatives
- Clearer calls-to-action (CTAs)
Even small CTR improvements can significantly reduce your overall advertising costs.
Cost Per Click (CPC): Managing Traffic Costs
CPC = average amount you pay each time someone clicks your ad.
For Australian businesses, typical Facebook CPC ranges:
- $0.80 - $2.50 AUD for many industries
- $2.00 - $5.00+ AUD in competitive sectors like legal, finance, and real estate
Lower CPC lets you drive more traffic for the same budget. The most effective way to reduce CPC is to improve CTR. When more people click your ad, Facebook rewards you with better placement at lower cost.
Conversion Rate: Measuring Landing Page Performance
Conversion rate = (conversions ÷ clicks) × 100
A “conversion” can be a purchase, enquiry, booking, signup, or any key action.
Typical averages across industries:
- Conversion rate varies sharply by objective and by industry
- 15-25%+ for top performers
If you have good CTR but low conversion rate, the issue is usually after the click:
- Landing page design and usability
- Offer strength and clarity
- Message match between ad and landing page
- Page speed and mobile experience
If visitors aren’t converting, focus on improving your web design, landing page optimisation, and value proposition.
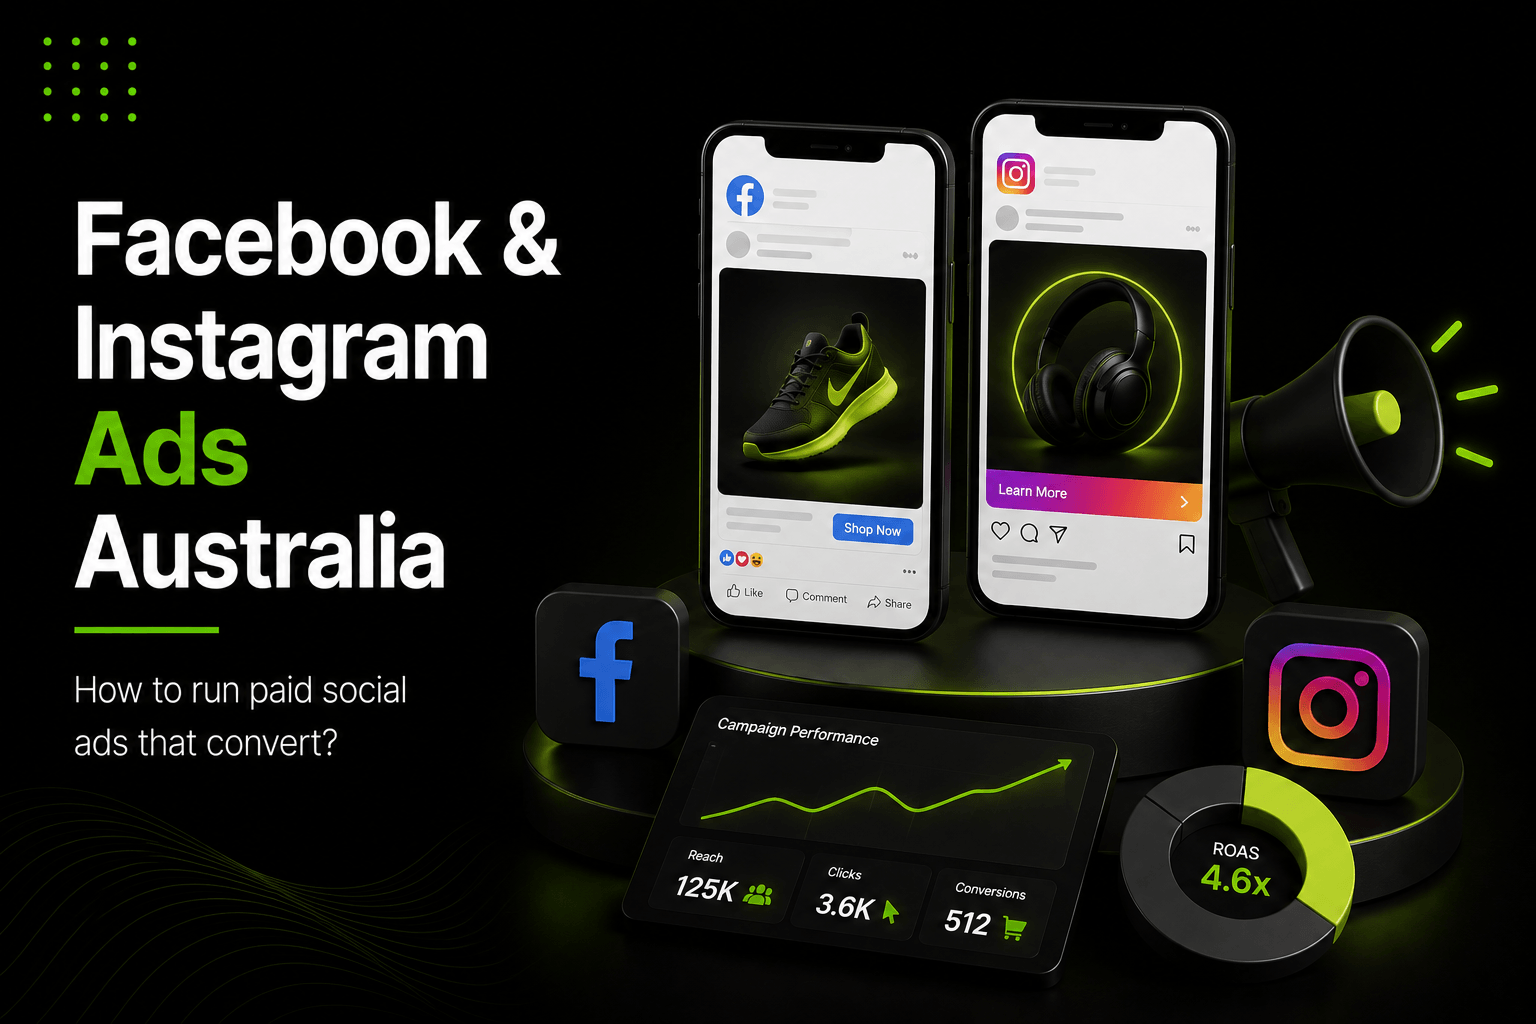
Return on Ad Spend (ROAS): The Ultimate Profitability Metric
For eCommerce and businesses tracking revenue, ROAS is the key metric.
ROAS = revenue generated ÷ ad spend
Example:
- Spend: $1,000
- Revenue: $5,000
- ROAS = 5:1 (or 500%)
Typical targets:
- Minimum: 3:1 ROAS (often breakeven or modest profit after product costs)
- Good: 4:1 - 6:1
- Excellent: 7:1+
ROAS tells you directly whether your Facebook advertising is financially sustainable.
Cost Per Lead (CPL) or Cost Per Acquisition (CPA)
For lead generation or conversion campaigns, track CPL/CPA:
- CPL = cost per lead (enquiry, form fill, signup)
- CPA = cost per acquisition (actual customer or sale)
Australian benchmarks (approximate):
- Local services (plumbing, electrical): $15 - $40 CPL
- B2B professional services: $30 - $100+ CPL
- Real estate: $20 - $80 CPL
- eCommerce: $25 - $150+ CPA (depending on product value)
Compare your CPL/CPA to customer lifetime value (LTV):
- If CPA < 20-30% of LTV, you’re usually in a sustainable range.
- If acquiring customers costs more than they’re worth, you need to optimise or reconsider your approach.
Understanding Facebook Ad Targeting and Audiences
Audience targeting is often the single biggest driver of Facebook ad performance. Even the best creative will fail if it’s shown to the wrong people.
Three Core Targeting Approaches
1. Custom Audiences (Warm Traffic)
Retarget people who already know your brand:
- Website visitors
- Email subscribers
- App users
- People who engaged with your Facebook/Instagram content
Retargeting campaigns typically achieve higher conversion rates than cold campaigns because these users already have brand familiarity.
2. Core Audiences (Cold Traffic)
Reach new potential customers based on:
- Demographics: age, gender, location, education, job title
- Interests: hobbies, pages followed, content engagement
- Behaviours: purchase patterns, device usage, travel
For Australian businesses, geographic targeting (city, state, or radius around your business) is especially powerful for local services and bricks‑and‑mortar stores.
3. Lookalike Audiences (Scale from What Works)
Lookalike audiences use Meta’s algorithm to find new users similar to your best existing customers.
Steps:
- Build a high-quality source audience (e.g. top customers, high-value purchasers, or recent converters).
- Choose your target location (e.g. Australia, specific states).
- Let Facebook find people who “look like” that source group.
Lookalike audiences often outperform broad interest targeting by 50-100%.
According to Facebook’s advertising research, highly accurate targeting can deliver 3x better performance than broad targeting, with lower costs and higher conversion rates.
Campaign Types and Budgeting Strategy
Facebook structures campaigns around three primary objectives:
- Awareness - build brand recognition and reach
- Consideration - drive traffic, engagement, video views, or leads
- Conversion - generate sales or specific high-value actions
Awareness and consideration campaigns usually cost 30-50% less than conversion campaigns but focus on top‑ and mid‑funnel goals, not immediate sales.
Conversion campaigns optimise for purchases, signups, or bookings. They generally:
- Require higher budgets
- Need proper conversion tracking (Meta Pixel, Conversions API)
- Work best when you already have some traffic and data
Setting Realistic Budgets
When launching new campaigns:
- Start with $20-$50 per day to gather data.
- Define your acceptable CPA based on customer LTV.
- As a rule of thumb, aim for CPA at 20-30% of LTV for sustainable profitability.
Scaling tips:
- Increase budgets on winning ad sets by 20-30% every few days.
- Avoid doubling budgets overnight; this can reset the learning phase and hurt performance.
Testing, Optimisation, and Continuous Improvement
Successful Facebook advertising is not “set and forget”. It’s an ongoing process of testing and refinement.
Key elements to test:
- Creative - headlines, primary text, images, videos, offers, CTAs
- Audiences - demographics, interests, custom audiences, lookalikes
- Placements - Facebook Feed, Instagram Feed, Stories, Reels, Audience Network
- Bidding strategies - lowest cost, cost caps, bid caps (where appropriate)
Run A/B tests with sufficient budget and duration to reach statistical significance. Monitor campaign performance daily to catch major issues, but make optimization decisions weekly after gathering sufficient data.
Pause underperforming ad sets that exceed 2x your target CPA without conversions. Increase budgets on profitable ad sets gradually. Refresh creative every 2-4 weeks to prevent ad fatigue as audiences become desensitized to repeated ads.
Facebook Ads vs. Other Platforms
Facebook advertising works particularly well for visual products (fashion, food, home decor), local service businesses targeting geographic areas, eCommerce with clear product catalogs, and B2C brands reaching consumer audiences. The platform excels at awareness and consideration stages with sophisticated interest and behaviour targeting.
However, Google Ads often outperforms Facebook for high-intent searches where users actively seek solutions. LinkedIn typically performs better for B2B marketing targeting enterprise decision-makers. The most successful Australian businesses integrate Facebook advertising into comprehensive marketing strategies that include SEO for organic visibility, email marketing for lead nurturing, and conversion-optimized websites.
According to Meta's own data, businesses advertising on Facebook see an average return of 2.8:1 ROAS, with top performers achieving 7:1 or higher.
So Are Your Facebook Ads Working?
To definitively answer whether your Facebook ads are working and worth continuing:
1. Check your ROAS or ROI: Are you generating more revenue than you're spending? Aim for minimum 3:1 ROAS for sustainability.
2. Compare CPA to customer lifetime value: Is your cost per acquisition low enough to be profitable long-term?
3. Monitor trend lines: Are your key metrics (CTR, conversion rate, CPA) improving or declining over time?
4. Benchmark against industry standards: How do your CTR, CPC, and conversion rates compare to industry averages?
5. Test systematically: Are you continuously testing and improving, or running the same ads indefinitely?
If you're achieving profitable ROAS, acquiring customers at acceptable costs, and seeing stable or improving metrics, your Facebook ads are working. If costs are rising, conversion rates are declining, or ROAS is below breakeven, you need optimization or may need to reconsider the channel.
The key is treating Facebook advertising as a continuous optimization process rather than a "set and forget" tactic. Success requires commitment to testing, learning from data, and refining based on performance.
Need a Hand with Facebook Advertising?
Evaluating Facebook ad performance and optimizing campaigns for profitability requires expertise across analytics interpretation, audience targeting, creative development, and landing page optimization.
At Ziff Digital, we specialize in helping Australian businesses build and scale profitable Facebook and Instagram advertising campaigns that deliver clear ROI. Whether you're struggling to understand your current ad performance, need expert social media marketing support to improve results, or want to integrate paid advertising with your broader digital strategy - our experienced team can help.
Our comprehensive approach combines strategic campaign planning, data-driven optimization, compelling creative development, and conversion-optimized landing pages to ensure your advertising investment drives sustainable business growth.
Request a Custom Facebook Advertising Strategy Session Today and discover how we can help you measure performance accurately, optimize for profitability, and scale your business through strategic Facebook advertising.
Thanks for reading - from the results-driven team at Ziff Digital.